
CoRAVEN: Model-Based Design of a Cognitive Tool for Real-Time Intelligence Monitoring and Analysis
|
|
|
|
|
|
Abstract
We describe a model-based design method to develop CoRaven,
a decision support tool is intended to assist military intelligence
analysts in managing and interpreting large quantities of battlefield
information. In this method, we use observations of practitioners
solving specific tasks in order to understand and model how they
use information. We use this model of the task to help identify
user needs that the tool must support, and, during initial prototyping,
to guide usability analyses. We have found task-models to be an
important consideration in the decision support tool design process
that can help to constrain the design space and reduce the time
required to develop effective decision support tool prototype
Decision support can be defined very broadly as a process that enhances human problem solving or decision making [1]. Decision support systems can provide support for tasks such as formulation, analysis, and interpretation [2], information retrieval, analysis, and reasoning [3], and situation assessment, planning, execution, and monitoring [4].
In the area of aiding human decision making, the emerging
human centered design (HCD) methodology of many design professionals
emphasizes the use of computers to support humans, rather than
replace them. These researchers (e.g., [5]),
go beyond the practice of good user interface design, advocating
the creation of human decision support systems based on modularity,
integration, and intelligent management of information and tasks.
In the military domain, "intelligence" refers to knowledge of the enemy: the collection, management, and analysis of data and information about enemy locations, forces, etc. Intelligence is a standard function performed by a collection of specialists on a commander’s staff. The work of Intelligence Collection Management (CM) and Analysis has a precisely defined role in military operations [6][7]. Our focus is on the "Analyze Intelligence" function. The earlier planning sub-functions turn the intelligence needs of the commander's operational plan into formalized Intelligence Requirements (IRs) and Priority Intelligence Requirements (PIRs), which in turn lead to Specific Information Requests (SIRs). Such requirements form the list of questions that the commander wants the intelligence staff to answer (for example, "Is the enemy in the north or south?", "Where are the major counterattack forces?", and "What is the chance of biological or chemical warfare?"). To answer these questions, the intelligence staff must create a Collection Plan in which collection assets are scheduled for use via a visual representation called a Synchronization Matrix.
The "Analyze Intelligence" function is the real-time
monitoring, analysis, and interpretation of these incoming battlefield
intelligence messages. This is a critical and essential part
of battle planning, because understanding the enemy's activities
is critical in being able to decide what is the best course of
action for the friendly forces to take [8].
The initial CoRaven prototype was developed using a number of knowledge acquisition methods:
The approach taken to the analysis of problem solving in this domain was practice-driven. This is to say that the analysis began by identifying the actual verbal and gestural behaviors and inscriptions which the subjects employ to interact, communicate, deliberate and solve the problem. The practices that dominated the problem-solving process were:
To more clearly visualize the cognitive tasks of the intelligence analyst during the problem solving session, we developed the task model diagram presented in Figure 1.
Figure 1 is a model of the tasks as they evolved over time for our subject analysts. We included the basic cognitive processes they appeared to use, and broke these down into roughly discrete cognitive tasks. We also attempted to connect the cognitive subtasks with the cognitive results that appeared to be constructed over time by our subjects. Finally, we also analyzed the use of physical artifacts over time, and their relation to the cognitive tasks that were being performed.
The tasks performed by the subjects in the protocol appeared
to fall mainly into a few categories:
Identify the problem and form a general picture of the situation:
Identify patterns in reports:
Evaluate alternatives interpretations of reports:
Prune alternative interpretations:
Determine an "answer" for a PIR:
Figure 1: Task model of the
intelligence analysis process.
It was first necessary to narrow the scope of our problem by choosing a user group and deciding what assumed inputs the users should start with. We decided to create a tool to support the analyst in the subtasks of analyzing incoming messages and briefing the commander. We left the other tasks (of formulating the information collection plan, etc.) outside our scope for the time being. We made the working assumption that collection planning would be completed prior to using our tool. In that case, our inputs would be the results of collection planning: a synchronization matrix, a map marked with NAIs, a PIR tree (presumably created earlier by a collection manager), and a set of intelligence reports that would be received asynchronously as analysis proceeded. For development purposes we chose to create a "battlefield message agent" which takes a list of messages and times, and periodically delivers the appropriate intelligence messages at the appropriate time.
Given these assumptions, we used the task model to identify specific roles for the software tool and an appropriate set of data visualization functions for that tool to perform.
From our observations, it was clear that the subjects used multiple representations of the same data: spatial (map), temporal (schedule) and logical (the connections between reports, interpretations, and information needs or PIRs). We therefore designed three different windows for each of these views: spatial (map), temporal (schedule or synchronization matrix) and logical. The map and synchronization matrix views were ones that are already described in doctrine and would therefore be familiar to users. However, they did not have specific methods for representing the logical connections between all these data.
One of our expert subjects reported that he felt that Bayesian Belief Networks (BBNs) closely mirrored the logical process that he used in intelligence analysis, so we decided to experiment by providing a visualization of task-appropriate belief networks.
Lastly, we needed to provide a way for users to link information
between these multiple representations. Thus we decided to implement
a "concept-linking" function that would allow users
to highlight data in one representation (for example to highlight
an NAI on the map) and to see that same NAI highlighted in the
schedule and in the BBN as well.
CoRaven’s interface allows users to either view or listen to changing tends over time. Users can view data in three different ways: spatially, logically or temporally. An example of CoRaven's displays are shown in Figures 2 and 3.
With the spatial view (Figure 2), users can see where battlefield activity is taking place on a geographic map representation. Using a Bayesian belief network (BBN) structure, users can view the logical view (Figure 3), showing how reports and battlefield activity support various battlefield conclusions. Additionally, the inference capability of the network allows CoRaven to calculate the probability of various conclusions based on current evidence.
There are two ways to view temporal information (both shown in Figure 3): A synchronization matrix. display allows users to view the schedule of intelligence gathering activities in the form of a Gantt chart, and a message window shows the (simulated) SALUTE reports as they arrive.
The spatial/geographic view of the data allows users to see the named areas of interest (NAIs) on the map (shown in Figure 2 as small rectangular boxes) where enemy activities are occurring. The different colored outlines represent different types of NAIs (for example, NAIs associated with identifying enemy counterattack forces, artillery, etc.). When analysts use paper maps, they typically mark the NAIs in magic marker on a sheet of clear acetate that they overlay on the map.
Figure 2: A CoRaven map with NAIs, LDTs and AAs.
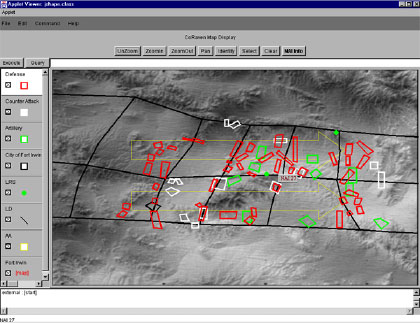
Figure 3: CoRaven displays including the BBN, Sync Matrix and Message windows.
Other important markings on map include avenues of approach and phase lines. Avenues of Approach (AAs) are shown as large horizontal arrows pointing to the right hand-side of the map.
These represent the portions of the terrain through which friendly (and enemy forces) can move. Avenues of approach often roughly follow valleys, and mountains or other obstacles may restrict movement between them.
Also important are the five roughly vertical lines that cut across the AAs. These are Phase Lines (PLs), reference lines used to describe the advance of both friendly and enemy forces. These particular phase lines also follow Lines of Defensible Terrain (LDTs) which represent strings of choke points across the AAs. They are significant because they are the areas where defenses are most likely to be set up, and they are also the points at which firefights are likely to occur.
Additionally, users can highlight NAIs, phase lines or avenues of approach on the map, and see the corresponding nodes highlighted in the BBN. This tool is intended to help users in the function of identifying patterns in the data.
In the left hand side of Figure 3 is a window showing the tree-like Bayesian Belief Network (BBN). This network shows possible battlefield conclusions (such as, "The enemy is moving in the North" or "The enemy is moving in the South"), along with the evidence supporting those various conclusions (such as "JSTARS show aggregate movement in the North."). Conclusions and supporting evidence are represented as a set of BBN trees: the conclusions are the roots, and the evidence supporting it, the branches. Additionally, the BBNs calculate the likelihood of each conclusion based on the current evidence.
In order to help users monitor changes in the battlefield
data and situation, we provided two types of alarms: visual and
auditory. An example of visual alarms involves dynamic
highlighting of phase lines. In addition, with the data
sonification capability of CoRaven, users could not only see,
but also listen to the data to hear when critical events occurred,
or when important conclusions reached a critical threshold of
certainty.
Acknowledgments
Prepared through collaborative participation in the Advanced
Displays and Interactive Displays Consortium sponsored by the
U.S. Army Research Laboratory under Cooperative Agreement DAAL01-96-2-0003.
References
1 Rouse, W. Design for Success: A Human-Centered Approach to Designing Successful Products and Systems. New York: Wiley, 1991.
2 Sage, A. Organizational and behavioral considerations in the design of information systems and processes for planning and decision support. IEEE Transactions on Systems, Man, and Cybernetics, SMC-11, 640-678, 1981.
3 Zachary, W. A cognitively based functional taxonomy of decision support techniques. Human-Computer Interaction, 2, 25-63, 1986.
4 Rouse, W. Design and evaluation of computer-based decision support systems. In S.J. Andriole (ed.), Microcomputer Decision Support Systems (Chapter 11). Wellesley, MA: QED Information Systems, 1986.
5 Rouse, W., Geddes, N., and Curry, R. An architecture for intelligent interfaces: Outline of an approach to supporting operators of complex systems. Human-Computer Interaction, 3, 87-122, 1987.
6 Headquarters, Department of the Army. Field Manual 34-2: Collection Management and Synchronization Planning, March, 1994.
7 Jones, P. M., Hayes, C. C., Wilkins, D. C., Bargar, R., Sniezek, J., Asaro, P., Mengshoel, O., Kessler, D. and Lucenti, M. (1998). CoRAVEN: Modeling and Design of a Multimedia Intelligent Infrastructure for Collaborative Intelligence Analysis. Proceedings of the 1998 IEEE International Conference on Systems, Man, and Cybernetics, San Diego CA, October 1998.
8 Schlabach, J. The Illinois Architecture: A Framework that Provides New Opportunities for Applications in Battlefield. Master's Thesis, University of Illinois at Urbana-Champaign, 1997.